All interconnectors
Sat 31 Oct- Imported
- 61GWh
- Exported
- 12GWh
- Net in
- 49GWh
- Average net flow
- 2.05GW in
Into Great BritainOut of Great Britain
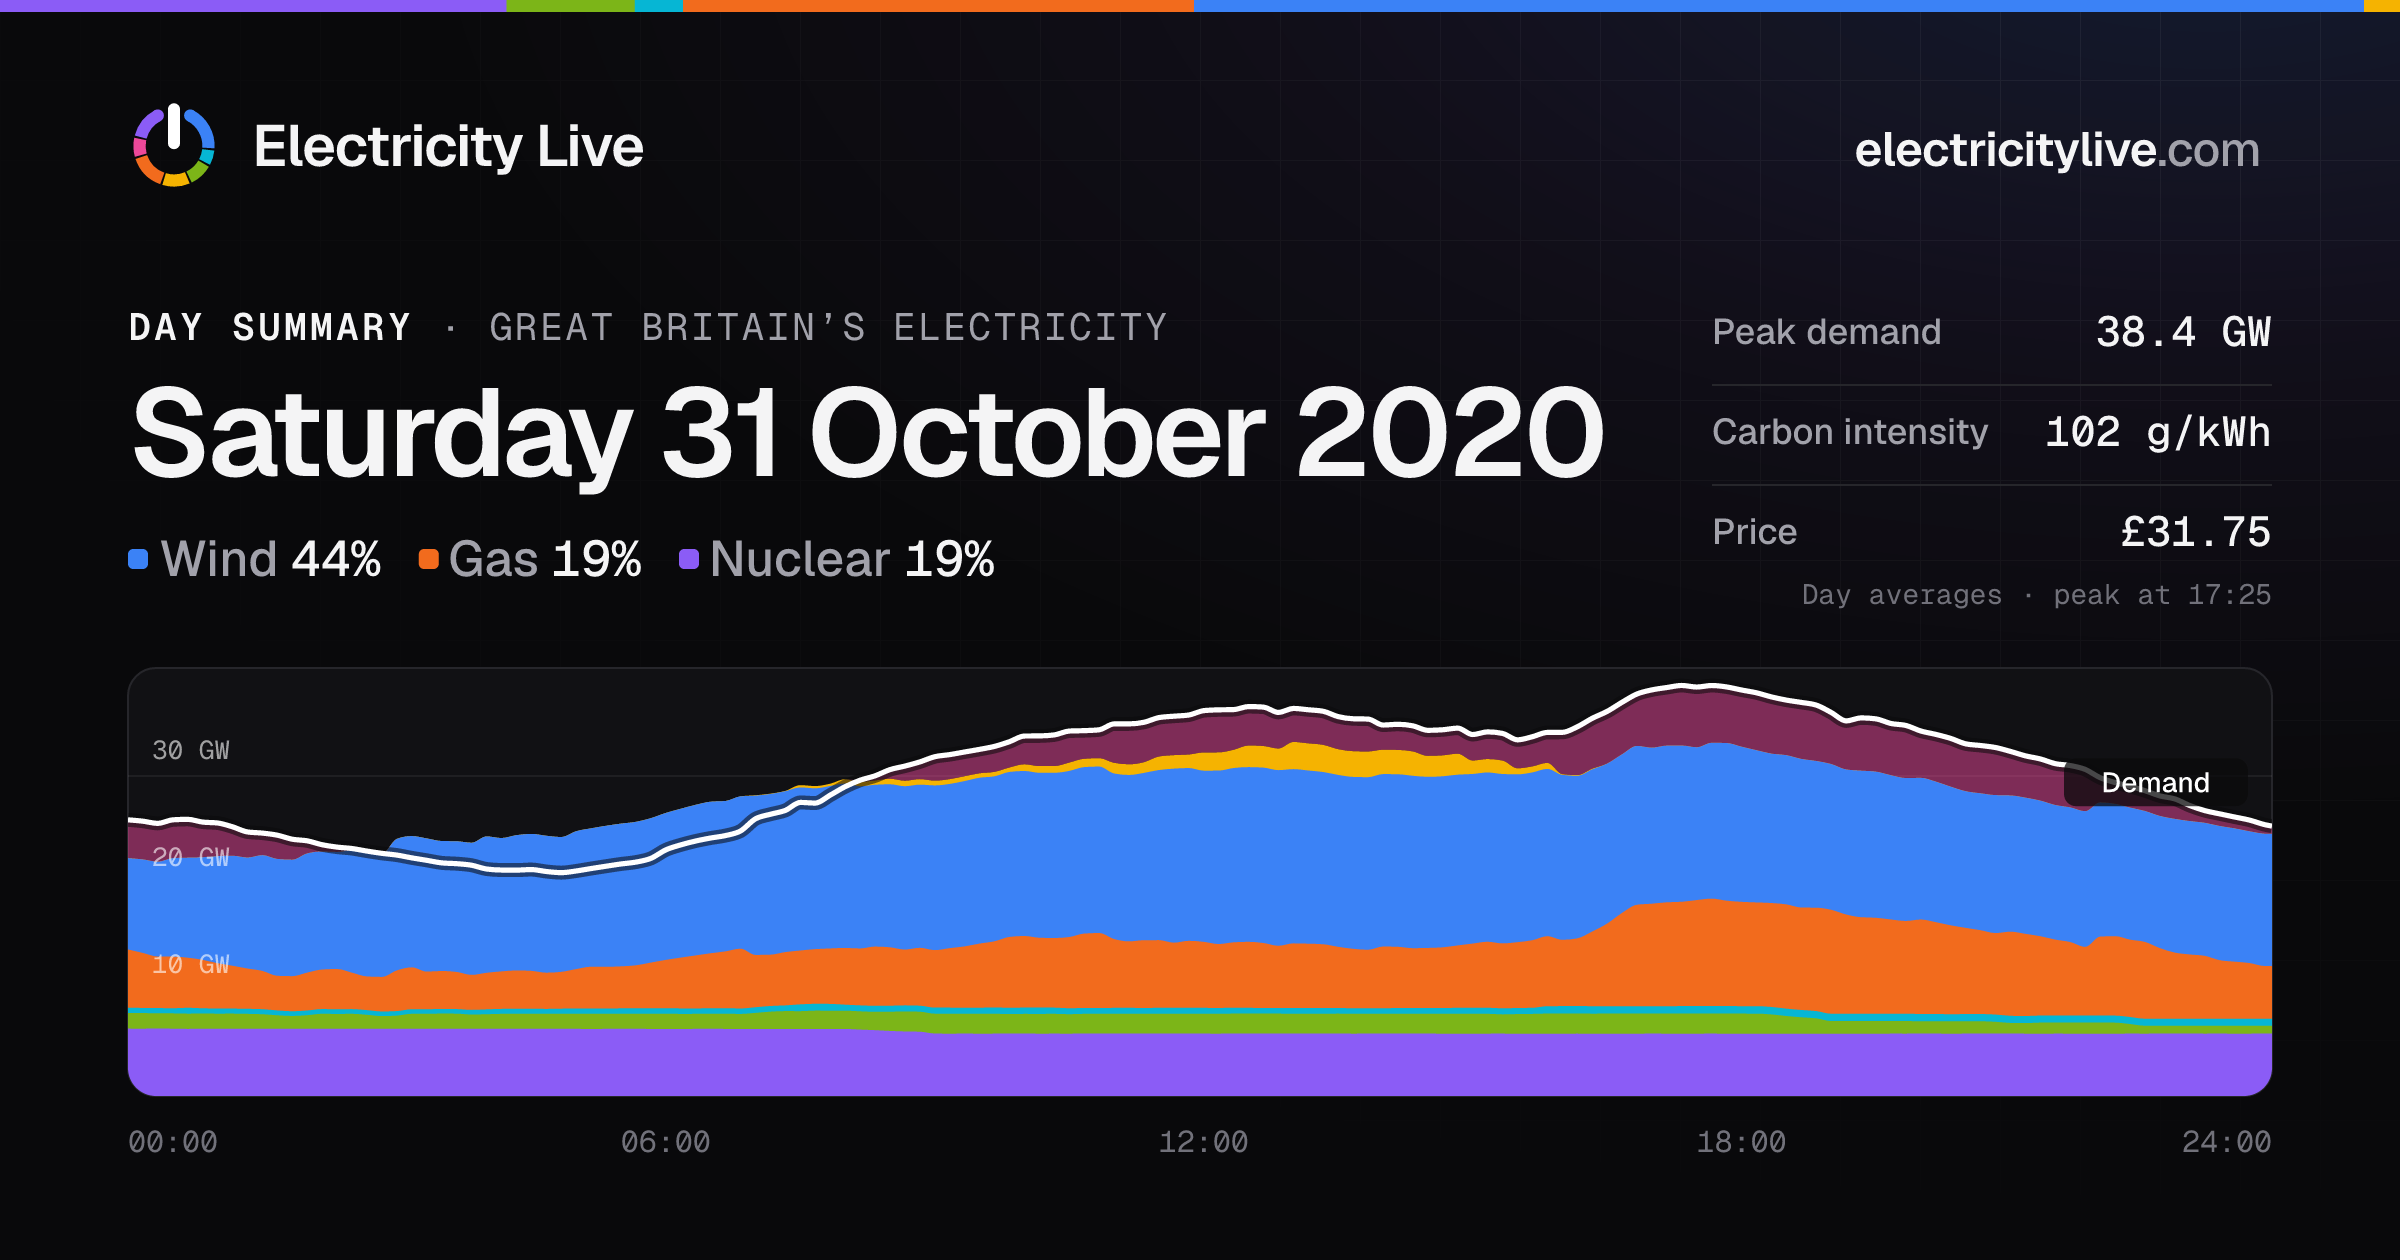
On Saturday 31 October, demand averaged 30.3 GW. Renewables supplied 48%.
On Saturday 31 October 2020, wind supplied 44% of Great Britain’s electricity and gas 19%. Demand peaked at 38.4 GW at 17:25. Carbon intensity averaged 102 g/kWh and the price £31.75/MWh. Wind generation peaked at 16.4 GW at 12:50. Solar generation peaked at 2.5 GW at 13:00. Carbon intensity was lowest at 02:00 (73 g/kWh) and highest at 16:30 (130 g/kWh). The wholesale price ranged from £15.79/MWh at 07:00 to £56.00/MWh at 17:30. Wind made 49% of the electricity generated in Great Britain, compared with 27% across 2020.
Charts
Transfers · Sat 31 Oct
On Saturday 31 October 2020, Great Britain imported 61 GWh and exported 12 GWh through its interconnectors. The most came from France (29 GWh), and the most exports went to France (6 GWh).
Into Great BritainOut of Great Britain
Average0.30GWImporting
In 9.9 GWhOut 2.7 GWh
Average0.00GWIdle
In 0.0 GWhOut 0.0 GWh
Average0.97GWImporting
In 28.9 GWhOut 5.6 GWh
Average0.53GWImporting
In 12.9 GWhOut 0.0 GWh
Average0.24GWImporting
In 9.2 GWhOut 3.3 GWh
Average0.00GWIdle
In 0.0 GWhOut 0.0 GWh
Average0.18GWPumping
Generated 6.6 GWhPumped 10.8 GWh
All cards share one scale, so you can compare their heights. Each country can have more than one cable.
Download the 5-minute data for this day: CSV · JSON. See what the figures mean.