All interconnectors
Wed 11 Nov- Imported
- 66GWh
- Exported
- 61GWh
- Net in
- 5GWh
- Average net flow
- 0.21GW in
Into Great BritainOut of Great Britain
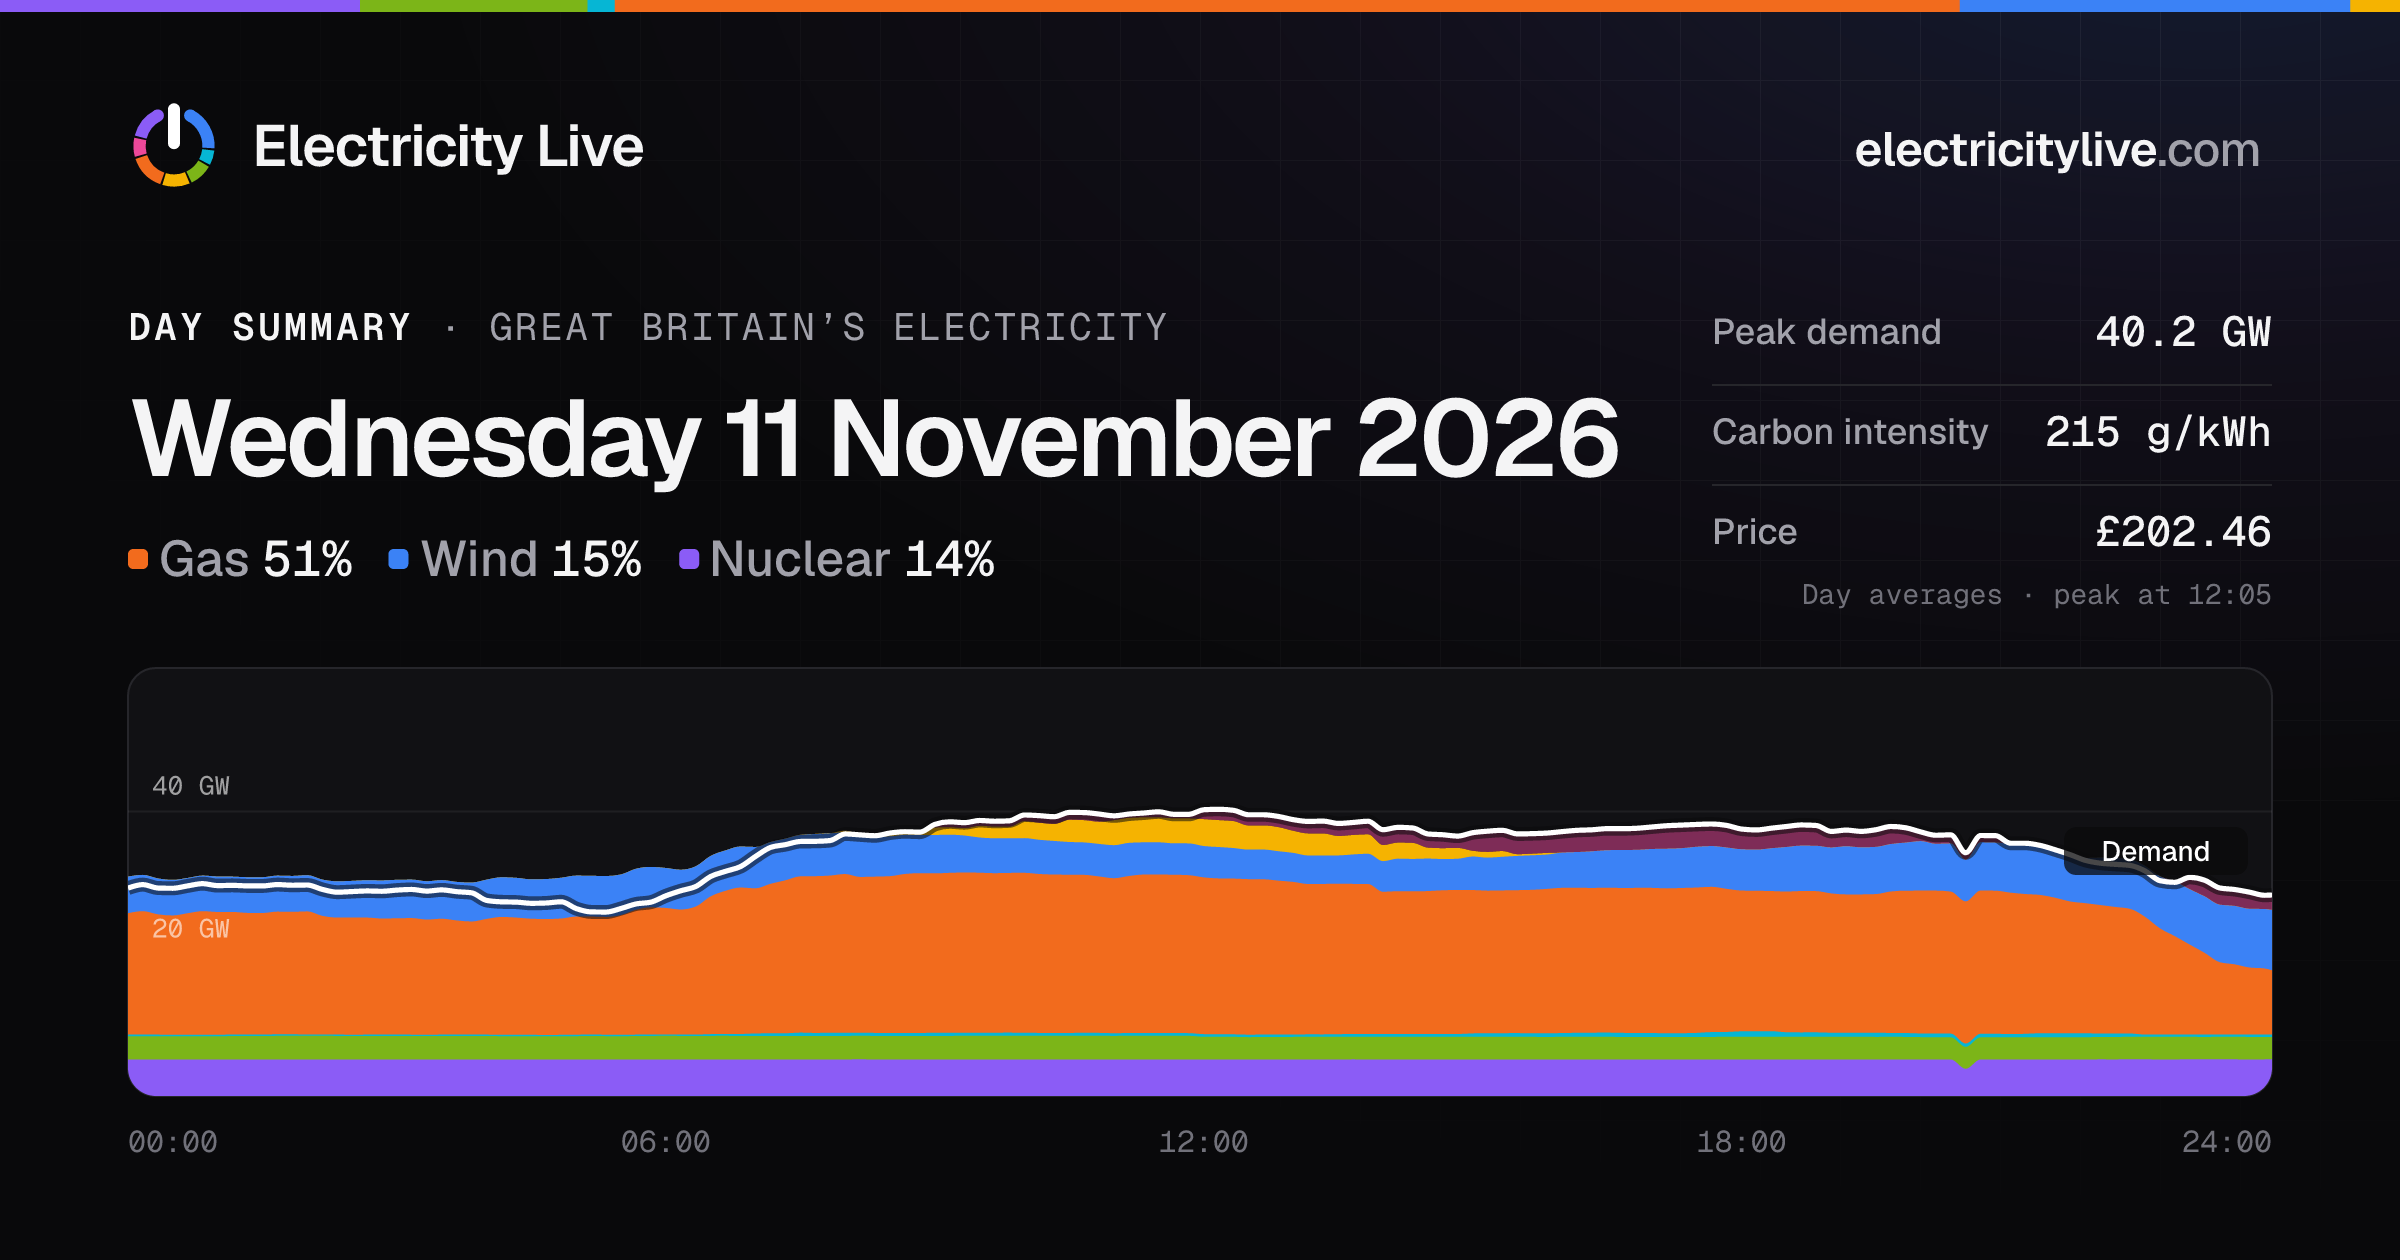
On Wednesday 11 November, demand averaged 34.3 GW. Renewables supplied 18%.
On Wednesday 11 November 2026, gas supplied 51% of Great Britain’s electricity and wind 15%. Demand peaked at 40.2 GW at 12:05. Carbon intensity averaged 215 g/kWh and the price £202.46/MWh. Wind generation peaked at 8.5 GW at 23:55. Solar generation peaked at 3.8 GW at 12:00. Carbon intensity was lowest at 23:30 (136 g/kWh) and highest at 06:00 (239 g/kWh). The wholesale price ranged from £145.39/MWh at 05:30 to £257.52/MWh at 15:30. Gas made 56% of the electricity generated in Great Britain, compared with 28% across 2026 so far.
Charts
Transfers · Wed 11 Nov
On Wednesday 11 November 2026, Great Britain imported 66 GWh and exported 61 GWh through its interconnectors. The most came from France (40 GWh), and the most exports went to Denmark (21 GWh).
Into Great BritainOut of Great Britain
Average0.58GWExporting
In 0.1 GWhOut 14.1 GWh
Average0.84GWExporting
In 0.5 GWhOut 20.6 GWh
Average1.67GWImporting
In 40.2 GWhOut 0.0 GWh
Average0.54GWExporting
In 0.0 GWhOut 13.0 GWh
Average0.55GWExporting
In 0.0 GWhOut 13.1 GWh
Average1.04GWImporting
In 25.4 GWhOut 0.3 GWh
Average0.06GWGenerating
Generated 7.8 GWhPumped 6.4 GWh
All cards share one scale, so you can compare their heights. Each country can have more than one cable.
Download the 5-minute data for this day: CSV · JSON. See what the figures mean.